Removing an asymmetric baseline#
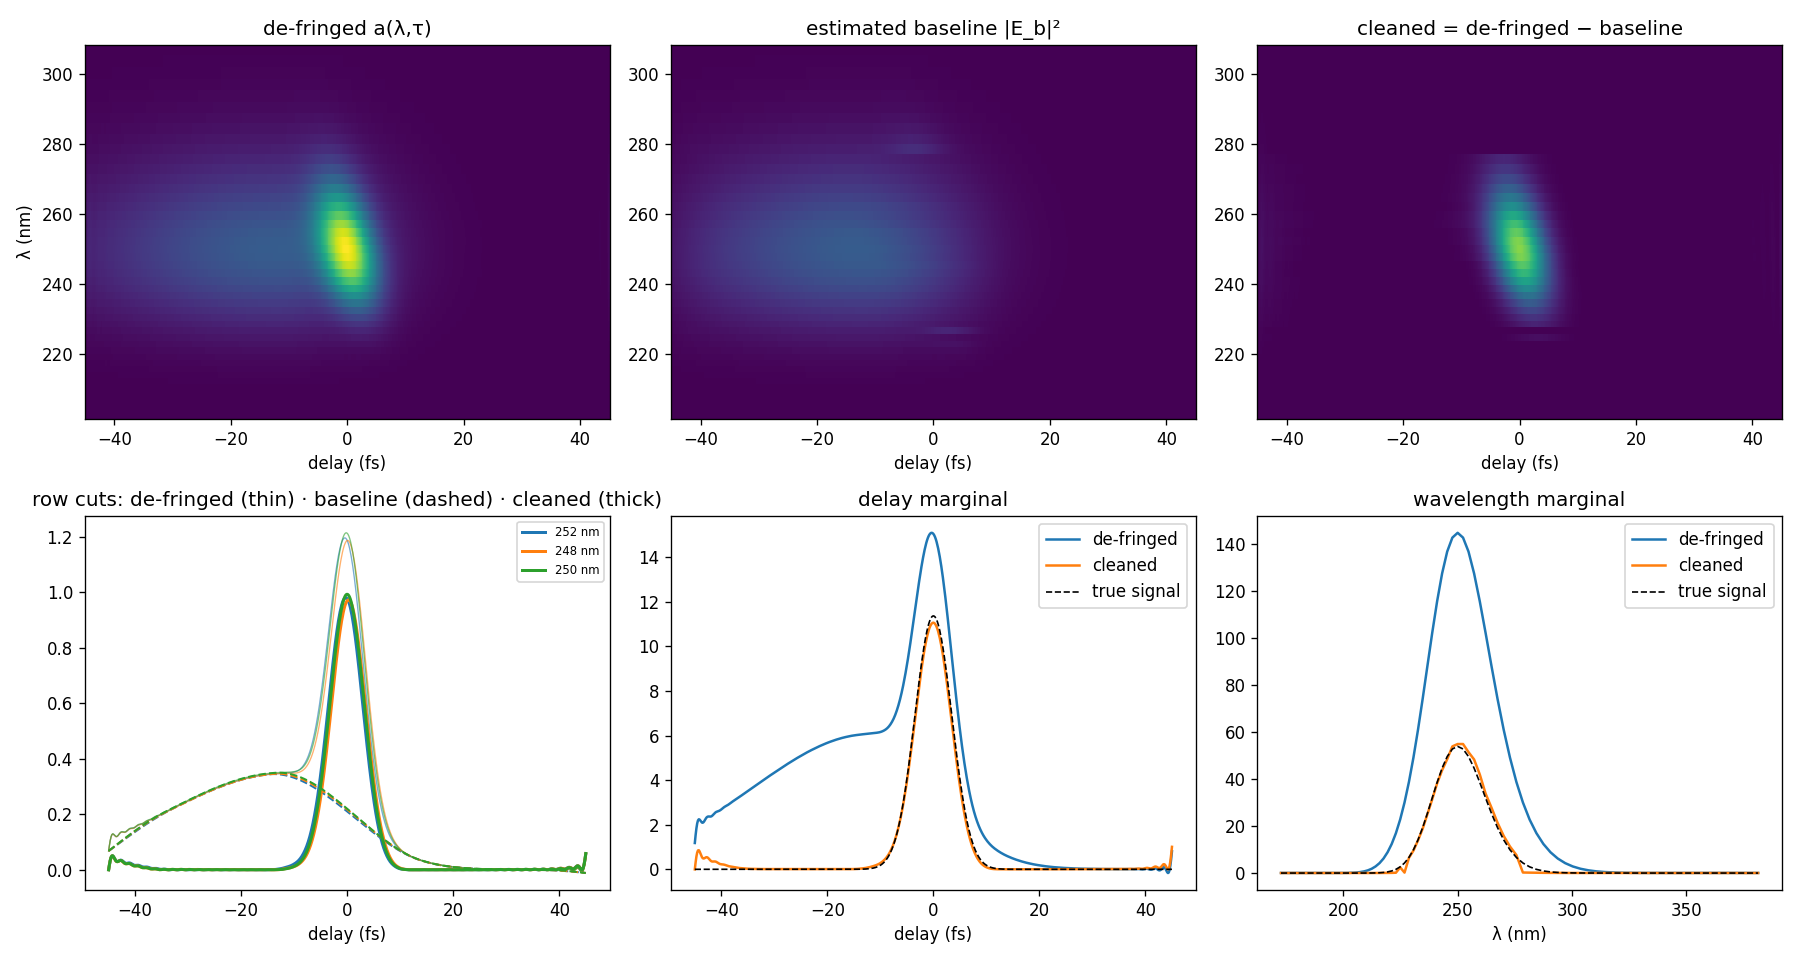
Estimate a smooth background beneath a synthetic FROG trace after fringe removal, using an asymmetric least-squares baseline with a protected peak.
Inputs and method#
The shared DUV generator supplies the same type of known envelope, fringes and background as the fringe example. The script first removes carrier fringes, then estimates and subtracts the baseline for each wavelength row.
Run from a source checkout:
uv run python examples/example_arpls_baseline.py
Calculation and output#
The cell below loads and executes the runnable script itself. Expand it to inspect
the source, or download example_arpls_baseline.py.
Generated files are isolated in a temporary directory for this documentation run.
Show code cell source
Hide code cell source
import os
import sys
import tempfile
from pathlib import Path
from IPython.display import Image, display

# The notebook starts in docs/examples. Keep generated files outside the checkout.
repository = Path.cwd().parents[1]
workspace = tempfile.TemporaryDirectory(prefix="croak-gallery-")
(Path(workspace.name) / "examples").symlink_to(repository / "examples", target_is_directory=True)
sys.path.insert(0, str(repository / "examples"))
os.chdir(workspace.name)
Show code cell source
Hide code cell source
"""Synthetic DUV TG-FROG trace carrying interferometric fringes and a leakage shelf.

Shared by :mod:`example_defringe` and :mod:`example_arpls_baseline`, which
demonstrate the two cleaning steps that a measured deep-ultraviolet
transient-grating FROG trace usually needs. Both are imported by filename from
the ``examples/`` directory, which Python puts on ``sys.path`` when it runs a
script from there.

The measurement model
---------------------
In a TG/PG geometry the spectrometer sees the signal field :math:`E_s` on top of
a leakage field :math:`E_b` — scattered pump light, or an imperfectly blocked
beam — that reaches the detector with a delay-dependent amplitude. The two
interfere, so the recorded trace is

.. math::

    I(\\lambda,\\tau) = |E_s|^2 + |E_b|^2
        + 2\\,|E_s|\\,|E_b|\\,\\cos\\!\\big(2\\pi f_c(\\lambda)\\,\\tau + \\phi\\big),

with the optical carrier :math:`f_c(\\lambda) = c/\\lambda`. That gives the three
components the cleaning chain has to separate:

* ``signal`` — :math:`|E_s|^2`, the FROG trace we actually want;
* ``baseline`` — :math:`|E_b|^2`, a broad shelf, **asymmetric** in delay
  (strong at negative delay, weak at positive), removed by
  :func:`croak.preprocess.arpls_baseline`;
* the cosine cross term — the diagonal fringes, removed by
  :func:`croak.preprocess.defringe_carrier`, which keeps only the DC band below
  :math:`f_c`.

Because each component is known exactly here, the examples can report the
actual recovery error, not only that the cleaning ran.

Sampling
--------
Resolving the fringes requires a delay step finer than half the carrier period,
:math:`\\delta\\tau < \\lambda/(2c)` — about 0.42 fs at 250 nm, far finer than a
FROG scan needs for the signal itself. Under-sampling folds the carrier back
below the Nyquist frequency and :func:`~croak.preprocess.defringe_carrier` then
refuses to run (``on_alias="raise"``). :data:`DELAY_STEP` is chosen with margin.
"""

from __future__ import annotations

from dataclasses import dataclass

import numpy as np
from numpy.typing import NDArray

import croak
from croak.constants import C
from croak.maths import wlfreq

__all__ = ["FringedTrace", "DELAY_STEP", "CARRIER_WAVELENGTH", "make_fringed_trace"]

#: Carrier wavelength of the synthetic DUV pulse (m).
CARRIER_WAVELENGTH = 250e-9

#: Delay step (s). Must satisfy dtau < lambda/(2c) ≈ 0.42 fs at 250 nm for the
#: fringe carrier to stay below the delay Nyquist frequency; 0.15 fs leaves a
#: factor ~2.8 of margin, which also covers the blue edge of the signal band.
DELAY_STEP = 0.15e-15


@dataclass(frozen=True)
class FringedTrace:
    """A synthetic measured trace together with the components it was built from.

    Attributes
    ----------
    lam : numpy.ndarray
        Wavelength axis (m), ascending, shape ``(Nlambda,)``.
    tau : numpy.ndarray
        Delay axis (s), uniform, shape ``(Ndelay,)``.
    measured : numpy.ndarray
        What the spectrometer records: ``signal + baseline + fringes``,
        shape ``(Nlambda, Ndelay)``.
    magnitude : numpy.ndarray
        The fringe-free magnitude trace ``signal + baseline`` — the exact target
        of :func:`croak.preprocess.defringe_carrier`.
    signal : numpy.ndarray
        The clean FROG trace ``|E_s|^2`` — the exact target of the full
        de-fringe-then-baseline chain.
    baseline : numpy.ndarray
        The leakage background ``|E_b|^2``.
    """

    lam: NDArray[np.float64]
    tau: NDArray[np.float64]
    measured: NDArray[np.float64]
    magnitude: NDArray[np.float64]
    signal: NDArray[np.float64]
    baseline: NDArray[np.float64]


def make_fringed_trace(
    *,
    fwhm: float = 5e-15,
    gdd: float = 8e-30,
    tau_max: float = 45e-15,
    baseline_amplitude: float = 0.35,
    fringe_visibility: float = 0.9,
    seed: int = 0,
) -> FringedTrace:
    """Build a synthetic fringed, background-contaminated DUV TG-FROG trace.

    Parameters
    ----------
    fwhm : float, optional
        Intensity FWHM of the underlying pulse (s). Default ``5e-15``.
    gdd : float, optional
        Group-delay dispersion applied to the pulse (s²), so the trace is
        visibly chirped. Default ``8e-30``.
    tau_max : float, optional
        Half-range of the delay scan (s); the axis spans ``[-tau_max, tau_max]``
        in steps of :data:`DELAY_STEP`. Wide enough that the broad leakage
        background decays to zero inside the scan. Default ``45e-15``.
    baseline_amplitude : float, optional
        Peak of the leakage shelf as a fraction of the signal peak. Default
        ``0.35``.
    fringe_visibility : float, optional
        Fringe contrast in ``[0, 1]``; the cross term is scaled by this times
        its maximum possible value ``2|E_s||E_b|``. Default ``0.9``.
    seed : int, optional
        Seed for the small amount of additive shot-like noise. Default ``0``.

    Returns
    -------
    FringedTrace
        The measured trace and each of its exact components.
    """
    omega0 = wlfreq(CARRIER_WAVELENGTH)

    # A grid whose time window comfortably exceeds the delay range plus the pulse,
    # so the gated signal never wraps around the periodic FFT window.
    grid = croak.Grid(256, dt=0.35e-15)
    ew = croak.gaussian_pulse(grid, fwhm, phases=[gdd])

    tau = np.arange(-tau_max, tau_max + 0.5 * DELAY_STEP, DELAY_STEP)
    # PG (transient-grating) is degenerate: the signal sits at the fundamental
    # wavelength, so the trace band is centred on CARRIER_WAVELENGTH.
    trace_omega = croak.maketrace(grid.omega, tau, ew, "pg")

    # Baseband angular frequency -> absolute -> wavelength, keeping only the
    # physical band and sorting to the ascending-lambda order a spectrometer
    # reports. Mirrors examples/example_workflow.py.
    omega_abs = grid.omega + omega0
    band = (omega_abs > 0.65 * omega0) & (omega_abs < 1.45 * omega0)
    lam = wlfreq(omega_abs[band])
    order = np.argsort(lam)
    lam = lam[order]
    signal = trace_omega[band][order, :]
    signal = signal / signal.max()

    # Leakage background |E_b|^2: separable in wavelength and delay. Spectrally it
    # is broader than the signal (scattered light is not gated, so it carries the
    # full pump bandwidth); in delay it is a broad, *skewed* bump — rising slowly
    # on the early side and falling faster once the beams separate. That is the
    # asymmetry arPLS has to follow, and unlike a step it decays at both ends of
    # the scan, so the trace stays smooth across the periodic FFT boundary.
    lam_profile = signal.sum(axis=1)
    lam_profile = lam_profile / lam_profile.max()
    # Broaden by convolving with a Gaussian a few samples wide.
    kernel = np.exp(-0.5 * (np.arange(-12, 13) / 5.0) ** 2)
    lam_profile = np.convolve(lam_profile, kernel / kernel.sum(), mode="same")
    lam_profile = lam_profile / lam_profile.max()
    # Much broader than the ~7 fs signal: the leakage is not gated by the pulse
    # overlap, so it varies on the beam-crossing scale. That scale separation is
    # exactly what lets arPLS tell background from signal.
    tau_centre, width_early, width_late = -12e-15, 22e-15, 12e-15
    width = np.where(tau < tau_centre, width_early, width_late)
    shelf = np.exp(-0.5 * ((tau - tau_centre) / width) ** 2)
    baseline = baseline_amplitude * lam_profile[:, None] * shelf[None, :]

    # Interferometric cross term at the per-wavelength optical carrier. The
    # geometric mean 2|E_s||E_b| is the largest a real interference term can be,
    # so fringe_visibility <= 1 keeps the trace non-negative.
    carrier = C / lam  # ordinary frequency f_c (Hz), one per wavelength row
    phase = 2.0 * np.pi * carrier[:, None] * tau[None, :]
    fringes = fringe_visibility * 2.0 * np.sqrt(signal * baseline) * np.cos(phase)

    magnitude = signal + baseline
    rng = np.random.default_rng(seed)
    noise = rng.normal(0.0, 2e-4, size=magnitude.shape)
    measured = np.clip(magnitude + fringes + noise, 0.0, None)

    return FringedTrace(
        lam=lam,
        tau=tau,
        measured=measured,
        magnitude=magnitude,
        signal=signal,
        baseline=baseline,
    )
Show code cell source
Hide code cell source
"""Clean a DUV TG-FROG trace: de-fringe, then arPLS baseline removal.

The full cleaning chain. Takeda de-fringing
(:func:`croak.preprocess.defringe_carrier`) removes the interferometric cross
term, then :func:`croak.preprocess.arpls_baseline` removes the broad,
*asymmetric* leakage background ``|E_b|²`` along delay — strong before the beams
separate and weak after — without touching the compact τ≈0 signal. Run::

    uv run python examples/example_arpls_baseline.py

The trace is synthetic (see :mod:`synthetic_duv_trace`), so the signal and the
background are both known exactly and the example reports the true recovery
error. Writes ``baseline_check.png``; read it as:

* **row cuts** (key panel) — the dashed baseline should ride *under* the
  de-fringed data, following the asymmetric shelf, without bowing up into the
  τ≈0 peak;
* **2-D maps** de-fringed → baseline → cleaned — the background should vanish
  while the compact signal stays put;
* **marginals** — the cleaned trace should land on the true signal.

Tuning ``SMOOTHNESS``: if the baseline bows into the peak (the cleaned peak comes
out too low) raise it, and/or set ``TAU_EXCLUDE_FS`` to hold out the peak; if it
fails to follow the shelf in the wings, leaving residual background, lower it.
The useful range for this trace is roughly 4–10. Note the best value depends on
how well separated the background and signal are in delay: a stiffer baseline
than the background's own curvature cannot follow it, and the leftover shows up
as a residual pedestal in the marginals long before it is visible in a row cut.
"""

from __future__ import annotations

import matplotlib
import numpy as np

matplotlib.use("Agg")
import matplotlib.pyplot as plt
from synthetic_duv_trace import make_fringed_trace

from croak.preprocess import arpls_baseline, defringe_carrier

# arPLS stiffness (larger ⇒ flatter baseline) and an optional peak hold-out window.
SMOOTHNESS = 5.0
TAU_EXCLUDE_FS = 0.0  # e.g. 8.0 to hold out |τ| < 8 fs if the peak is sucked up


def main() -> None:
    """Build, de-fringe, baseline-subtract, and write the comparison figure."""
    ft = make_fringed_trace()

    defr = defringe_carrier(ft.measured, ft.lam, ft.tau, carrier_fraction=0.5)
    baseline = arpls_baseline(
        defr,
        smoothness=SMOOTHNESS,
        tau=ft.tau,
        tau_exclude=TAU_EXCLUDE_FS * 1e-15 if TAU_EXCLUDE_FS > 0 else None,
    )
    cleaned = defr - baseline

    peak = ft.signal.max()
    print(f"trace: {ft.lam.size} wavelengths × {ft.tau.size} delays")
    print(f"RMS baseline error: {np.std(baseline - ft.baseline) / peak:.2%} of peak")
    print(f"RMS signal error:   {np.std(cleaned - ft.signal) / peak:.2%} of peak")
    print(f"peak height error:  {abs(cleaned.max() - peak) / peak:.2%}")

    _plot(ft, defr, baseline, cleaned)


def _plot(ft, defr, baseline, cleaned) -> None:
    """Six-panel de-fringe → baseline diagnostic; writes ``baseline_check.png``."""
    tau_fs = ft.tau / 1e-15
    lam_nm = ft.lam / 1e-9

    marg_lam = defr.sum(axis=1)
    sig = np.where(marg_lam > 0.05 * marg_lam.max())[0]
    lo, hi = lam_nm[sig[0]], lam_nm[sig[-1]]
    pad = 0.25 * (hi - lo)
    band = (lam_nm >= lo - pad) & (lam_nm <= hi + pad)
    vmax = float(defr[band].max())

    fig, ax = plt.subplots(2, 3, figsize=(15, 8))

    ax[0, 0].pcolormesh(tau_fs, lam_nm, defr, shading="auto", vmin=0, vmax=vmax)
    ax[0, 0].set_title("de-fringed a(λ,τ)")
    ax[0, 0].set_ylabel("λ (nm)")
    ax[0, 1].pcolormesh(tau_fs, lam_nm, baseline, shading="auto", vmin=0, vmax=vmax)
    ax[0, 1].set_title("estimated baseline |E_b|²")
    ax[0, 2].pcolormesh(tau_fs, lam_nm, cleaned, shading="auto", vmin=0, vmax=vmax)
    ax[0, 2].set_title("cleaned = de-fringed − baseline")
    for a in ax[0]:
        a.set_ylim(lo - pad, hi + pad)
        a.set_xlabel("delay (fs)")

    # KEY panel: row cuts with the baseline riding under the de-fringed data.
    rows = np.argsort(defr.sum(axis=1))[-3:]
    for i in rows:
        (line,) = ax[1, 0].plot(tau_fs, defr[i], lw=0.8, alpha=0.6)
        ax[1, 0].plot(tau_fs, baseline[i], "--", lw=1.2, color=line.get_color())
        ax[1, 0].plot(
            tau_fs,
            cleaned[i],
            lw=1.8,
            color=line.get_color(),
            label=f"{lam_nm[i]:.0f} nm",
        )
    ax[1, 0].set_title(
        "row cuts: de-fringed (thin) · baseline (dashed) · cleaned (thick)"
    )
    ax[1, 0].set_xlabel("delay (fs)")
    ax[1, 0].legend(fontsize=7)

    ax[1, 1].plot(tau_fs, defr.sum(axis=0), label="de-fringed")
    ax[1, 1].plot(tau_fs, cleaned.sum(axis=0), label="cleaned")
    ax[1, 1].plot(tau_fs, ft.signal.sum(axis=0), "k--", lw=1.0, label="true signal")
    ax[1, 1].set_title("delay marginal")
    ax[1, 1].set_xlabel("delay (fs)")
    ax[1, 1].legend()

    ax[1, 2].plot(lam_nm, defr.sum(axis=1), label="de-fringed")
    ax[1, 2].plot(lam_nm, cleaned.sum(axis=1), label="cleaned")
    ax[1, 2].plot(lam_nm, ft.signal.sum(axis=1), "k--", lw=1.0, label="true signal")
    ax[1, 2].set_title("wavelength marginal")
    ax[1, 2].set_xlabel("λ (nm)")
    ax[1, 2].legend()

    fig.tight_layout()
    fig.savefig("baseline_check.png", dpi=120)
    print("wrote baseline_check.png")


if __name__ == "__main__":
    main()
trace: 86 wavelengths × 601 delays
RMS baseline error: 0.53% of peak
RMS signal error:   0.53% of peak
peak height error:  0.74%
wrote baseline_check.png
Show code cell source
Hide code cell source
display(Image(filename="baseline_check.png"))
Interpretation and limits#
Compare the recovered trace with the known envelope and inspect the residual background and any loss near the peak. A baseline is an inferred component, not an independent background measurement. Broad physical wings can be removed if smoothness and peak protection are inappropriate. Prefer measured background information when available; see preprocessing.